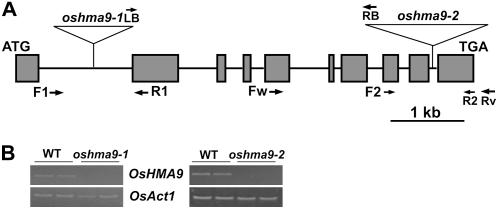
Figure 6.
Isolation of OsHMA9 knockout plants. A, Schematic diagram of OsHMA9 and insertion positions of T-DNA. Dark-gray boxes represent 10 exons; connecting black lines are nine introns. In line 1B03522, T-DNA was inserted into first intron (oshma9-1); in line 3A50792, into the ninth intron (oshma9-2) of OsHMA9. Horizontal arrows indicate primers (F1, R1, F2, and R2) used for genotyping T2 progeny. Fw, OsHMA9-specific forward primer; Rv, OsHMA9-specific reverse primer. B, RT-PCR analysis of OsHMA9 expression. Two replicates for wild type and oshma9 are shown. OsHMA9-specific primers (Fw and Rv) were used for RT-PCR analysis, with total RNA prepared from oshma9-1, oshma9-2, or wild-type (WT) plants at seedling stage. Rice actin1 (OsAct1) mRNA was amplified to show an equal amount of RNA in each sample.

