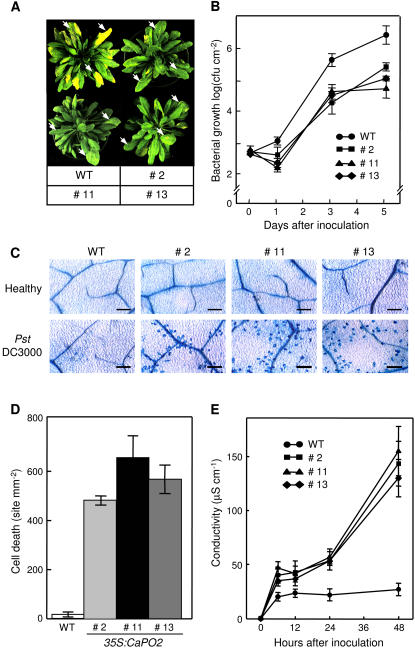
Figure 7.
Enhanced resistance of Arabidopsis CaPO2-OX plants to Pst DC3000 infection accompanied by micro-HRs. A, Disease symptoms developed on the leaves of wild-type and CaPO2-OX plants 7 d after inoculation (104 cfu mL−1). Arrows indicate infected leaves. B, Bacterial growth in the leaves of wild-type and CaPO2-OX plants 0, 1, 3, and 5 d after inoculation (104 cfu mL−1). Data are the means ± sds from three independent experiments. C, Trypan blue staining of micro-HRs in leaf tissues of CaPO2-OX plants 24 h after inoculation (106 cfu mL−1). Bars = 200 μm. D, Quantification of cell death. Clusters of dead cells were identified and quantified by the trypan blue staining of wild-type and CaPO2-OX leaves 24 h after inoculation (106 cfu mL−1). Data are the means ± sds from three independent experiments. E, Ion leakage from leaf discs of wild-type and CaPO2-OX plants 0, 12, 24, 36, and 48 h after inoculation (106 cfu mL−1). Data are the means ± sds from three independent experiments.

