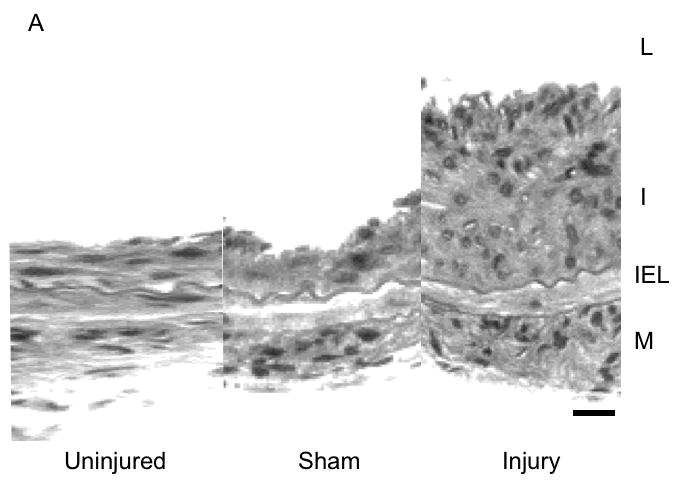
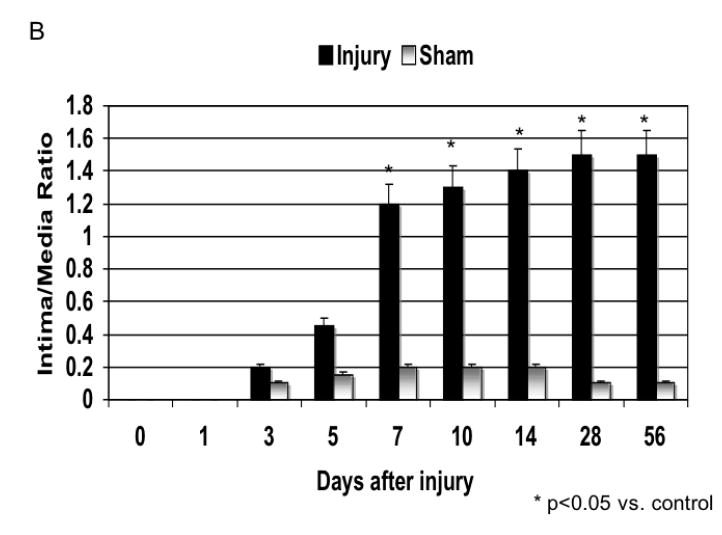
Figure 1.


Development of intimal hyperplasia over the time course of the study in wire injured femoral arteries. (A) Representative cross-sectional photomicrograph showing an uninjured, sham and injured vessel at day 56 vessel wall (L, lumen; I, intima; M, media; IEL, internal elastic lamina). (B) Quantification of the development of intimal hyperplasia over time in the injured and sham operated animals. Values are the mean± s.e.m of the intima:media area ratio (n=6 per group). Statistical differences between groups were tested with a Kruskal-Wallis non-parametric test with post hoc Dunn’s multiple comparison correction, where appropriate. A p-value less than 0.05 was regarded as significant. Non-significant p-values were expressed as p=ns
