Figure 4.


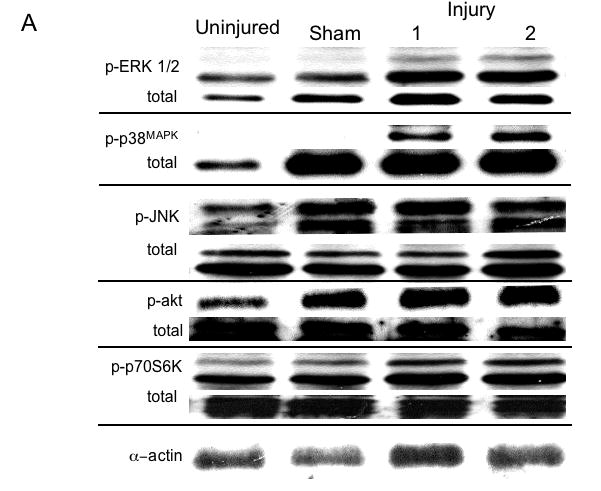
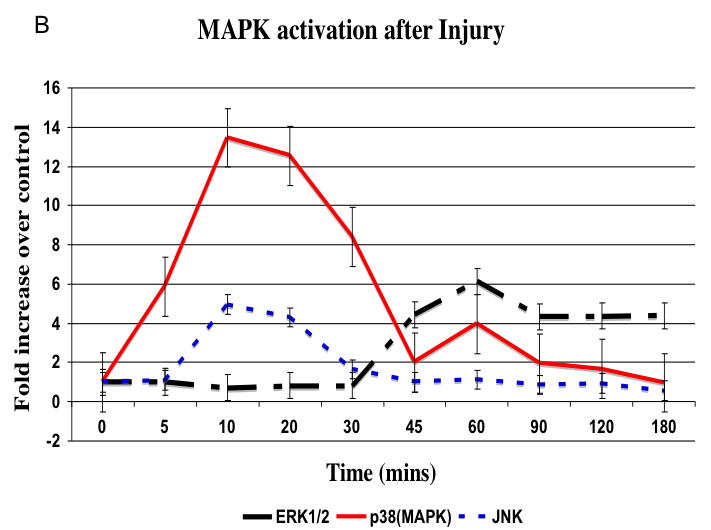
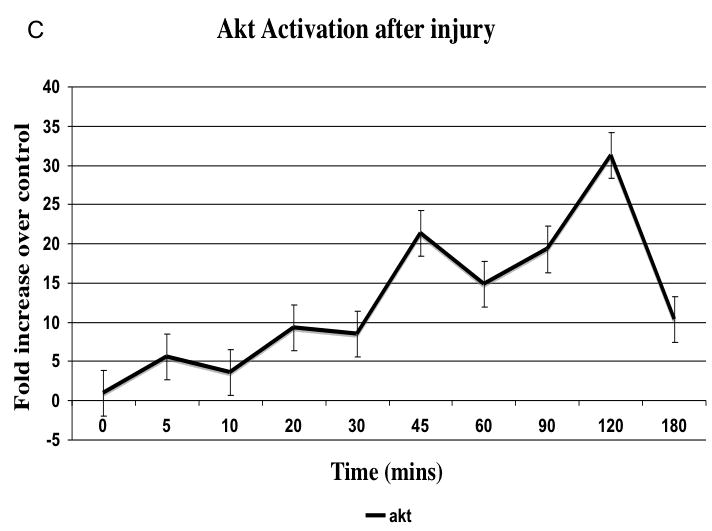
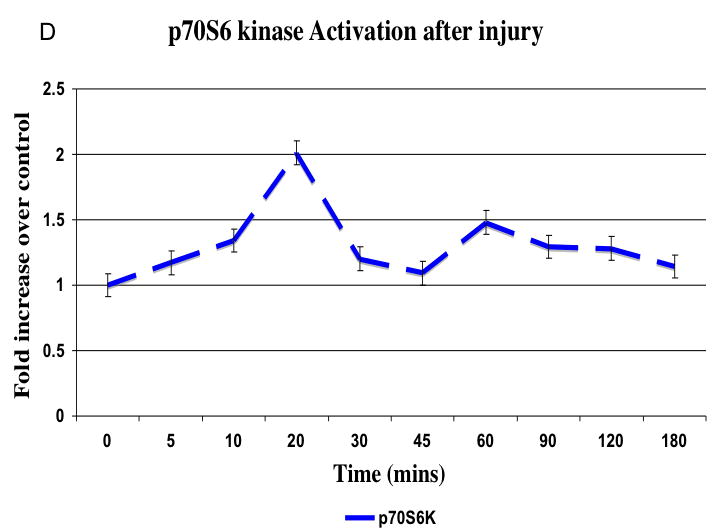
Representative western blots from uninjured, sham and injured femoral arteries at the maximal intensity of activation for each kinase are shown in (A). The time course of activated ERK1/2, p38MAPK and JNK (B) and activated akt (C) and p70S6 kinase (D) in the wire injured femoral vessels over time Activated kinases are normalized to the total kinase. All data are presented as the mean ± s.e.m. (n=6 per group) and statistical differences between groups were tested with a Kruskal-Wallis non-parametric test with post hoc Dunn’s multiple comparison correction, where appropriate.
