Figure 5.


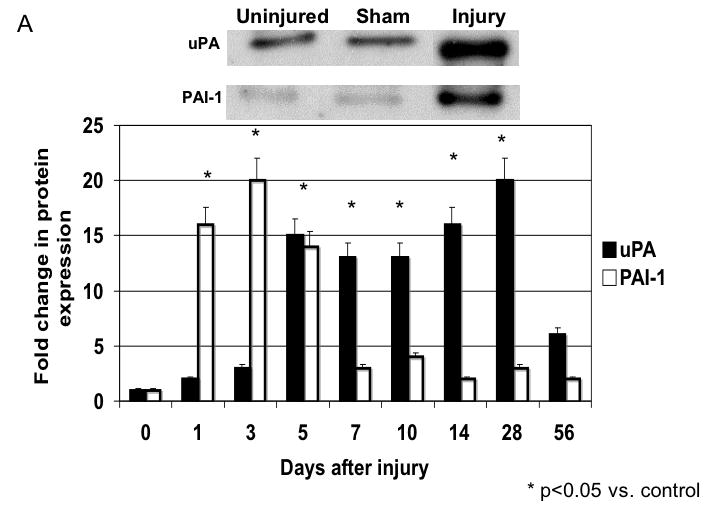
A The expression of uPA and PAI-1 in the wire inured femoral vessels over time. Top panel shows a representative western blots for uPA and PAI-1. Bottom panel shows the quantification of the data for the uninjured, sham and injured vessels. Values are the Mean± s.e.m. fold increase from baseline expression
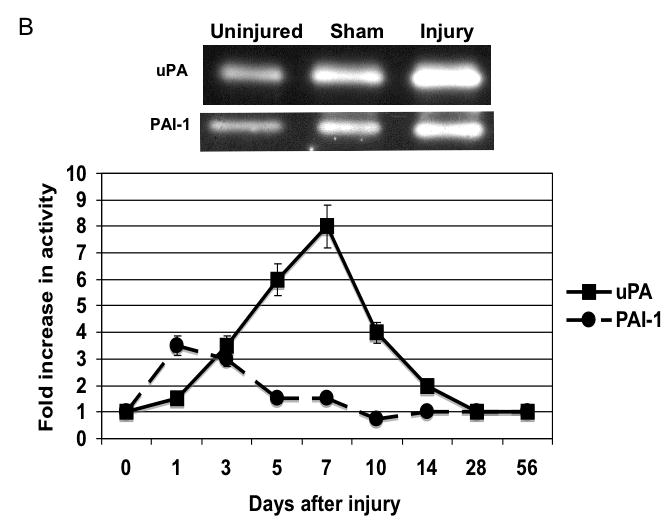
B The activity of uPA and PAI-1 as determined by plasminogen and reverse plasminogen zymography in lysates from wire injured femoral vessels. Top panel shows a representative zymograms for uPA and PAI-1 for the uninjured, sham and injured vessels. Bottom panel shows the quantification of the data. Values are the mean± s.e.m. fold increase from baseline expression (n=6 per group).
