Figure 2.

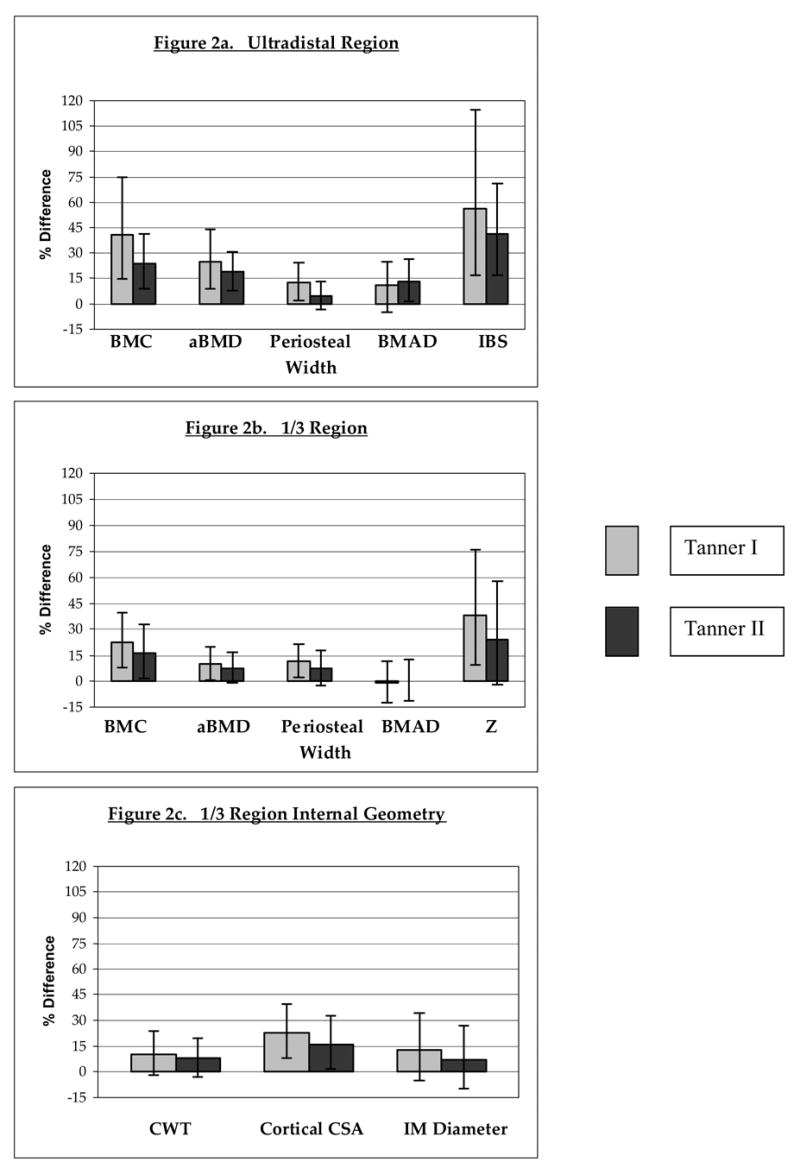
Percentage differences are depicted for bone parameters of gymnasts relative to non-gymnasts, divided by Tanner stage and bone site: a) ultradistal region; b) 1/3 region; c) 1/3 region internal bone geometry. Bars represent 95% confidence intervals.
BMC= bone mineral content; aBMD= areal bone mineral density; Periosteal Width= mean periosteal width; BMAD= bone mineral apparent density; IBS= index of bone strength in axial compression; Z= section modulus; CWT= cortical wall thickness; CSA= cross-sectional area; IM Diameter= intramedullary diameter.
For all percentage differences, p<0.05, except: Tanner II ultradistal mean periosteal width (p=0.076); 1/3 BMAD for both Tanner groups (p=NS); Tanner II 1/3 CWT (p=0.064); 1/3 IM diameter (Tanner I, p=0.06; Tanner II, p=NS).
