
Fig. 5.
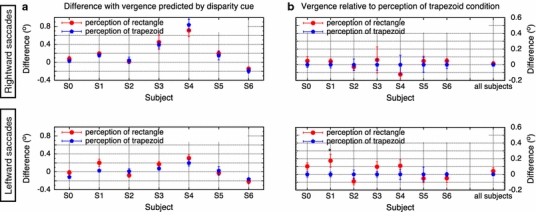
a Vergence (mean and SE selected as described in Sect. 2.4) relative to predicted vergence based on the disparity cue (0 on vertical axis) from leftward saccade trials (bottom) and rightward saccade trials (top). These data show that (1) there are individual biases (e.g. S4), (2) the “perception of rectangle” (red circle) is not less convergent than the “perception of trapezoid” (blue pentagon) condition for all subjects (e.g. S2, S5) and both directions (e.g. S4, S6), rebutting the predictions based on perception. b Vergence (mean and SE selected as described in Sect. 2.4) relative to “perception of a trapezoid” condition (0 on vertical axis). On the right side of these graphs the mean (and SE) of all subjects is shown. There is no systematic trend visible across subjects. All differences are nonsignificant except for S1, leftward saccade (F = 6.36, P < 0.05)