Figure 3.
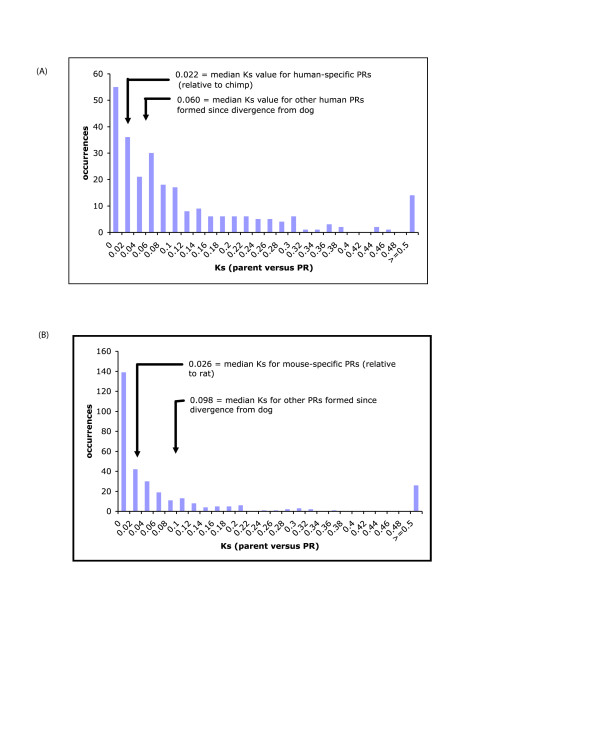
Ks distributions: (A) Ks distribution for human PRs meeting the local gene order test with threshold of Nhomologs = 0, from comparison to their parent sequences. Labelled are the median values for the 'Human-specific' set, and those PRs formed between divergence from dog and from chimp [see panel (C)]. A similar distribution is observed with an Nhomologs threshold of ≤ 1 for the local gene order test. (B) Ks distribution for mouse PRs meeting the local gene order test with threshold of Nhomologs = 0, from comparison to their parent sequences. Labelled are the median values for the 'Mouse-specific' set, and those PRs formed between divergence from dog and from chimp [see panel (C)]. A similar distribution is observed with an Nhomologs threshold of ≤ 1 for the local gene order test.

