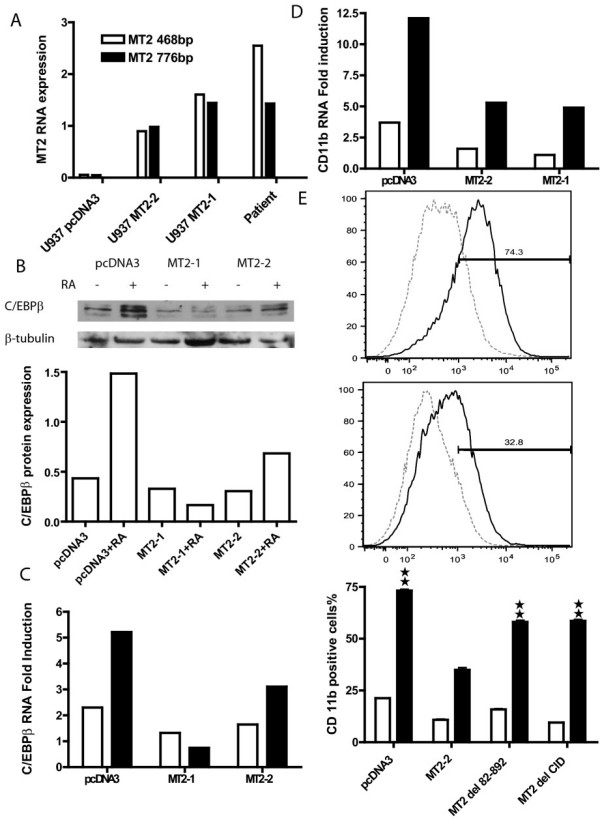
Figure 9.

Stable expression of MOZ-TIF2 in U937 cells down-regulates retinoic acid (RA)-mediated induction of CD11b and C/EBPβ genes. A. Relative expression of MOZ-TIF2 mRNA in stably transfected U937 cells and leukemia patient's blast. U937 cells were transfected with the pcDNA3.1 plasmid carrying the full length MOZ-TIF2 cDNA. After selection with G418, two clones were established, MT2-1 and MT2-2, and expression of MOZ-TIF2 (MT2) mRNA was examined by RT-PCR in the two clones, in the patient's blasts, and in U937 cells stably transfected with vector alone. B. Expression of C/EBPβ protein in RA treated U937 cells. Cells were treated with 1 μM RA for 72 hours, whole cell protein extracted with RIPA buffer, and proteins fractionated by SDS-PAGE. Western blot analyses were conducted with anti-C/EBPβ antibody. Top panel, western blot of C/EBPβ and β-tubulin. Bottom panel, relative level of C/EBPβ protein in control and MOZ-TIF2 expressing U937 cells after standardization to β tubulin levels used as a loading control. C. Expression of C/EBPβ RNA in RA treated U937 cells. Cells were treated with RA for 24 and 48 hours. RNA was extracted and RT-PCR was conducted as described in Experimental Procedures. The fold-induction by RA was calculated as RA treated sample over non-treated sample for 24 hours (open bars) and 48 hours (dark bars) of RA treatment. D. Fold-induction of CD11b RNA in RA treated U937 cells. Cells were treated with 1 μM RA for 8 and 48 hours. RNA was extracted, real-time RT-PCR conducted, and fold-induction by RA calculated comparing the RA treated sample to the non-treated sample. Open and dark bars, 8 and 48 hours of RA treatment respectively. E. Percentage of CD11b positive U937 cell after RA treatment. Cells were treated with 1 μM RA for 72 hours and were stained with APC-conjugated anti CD 11b antibody (eBiosciences, San Diego, CA.) After washing, the stained cells were analyzed by flow cytometry (BD Biosciences, Franklin Lakes, NJ) and the percentage of CD11b positive cells calculated with FlowJo 6.3 software. Top and middle panel, a representative histograph of CD11b stained U937 cells stably transfected with pcDNA3 (top) and MOZ-TIF2 (middle). Y-axis, % cell number and X-axis, APC stain intensity. The horizontal line scale represents the range of CD11b positive cells. The dashed and solid lines represent basal and RA treated U937 cells, respectively. The number above the line scale indicates percentage of CD11b positive cells after treatment with RA. Bottom panel, percentage of CD11b positive U937 cells stably transfected with control (pcDNA3), MOZ-TIF2 (MT2), MT2 del 82–892, and MT2 del CID. The experiment was conducted in triplicates with the open bars representing the basal level of CD11b positive cells and the dark bars representing the level of CD11b after RA treatment. Double stars represent a significant difference at P < 0.01 by a two tailed Student T- test compared to the RA treated U937 cells with MT2-2. The percentage inhibition cited in the text was calculated from the amount of RNA or protein expressed in MOZ-TIF2 expressing cells compared to that in pcDNA-transfected control cells in presence of RA subtracted from 100%.
