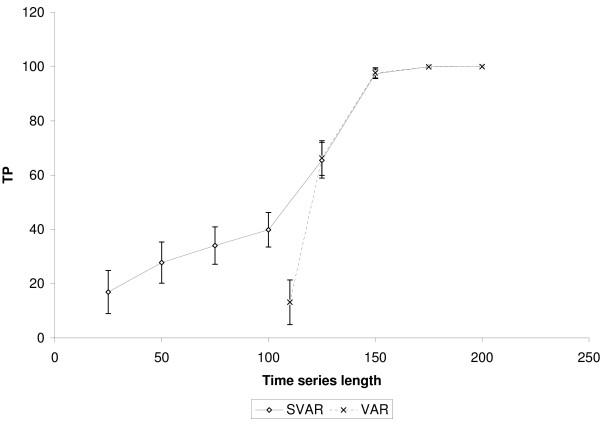
Figure 2.
Comparison between SVAR and VAR. The simulations were performed in a scale-free like network composed of 100 nodes and 100 edges. VAR was performed only for experiments with the length of the time-series of up to 110. TP: True positives. The number of false positives is controlled using q-value < 0.01. The error bar is representing one standard error.

