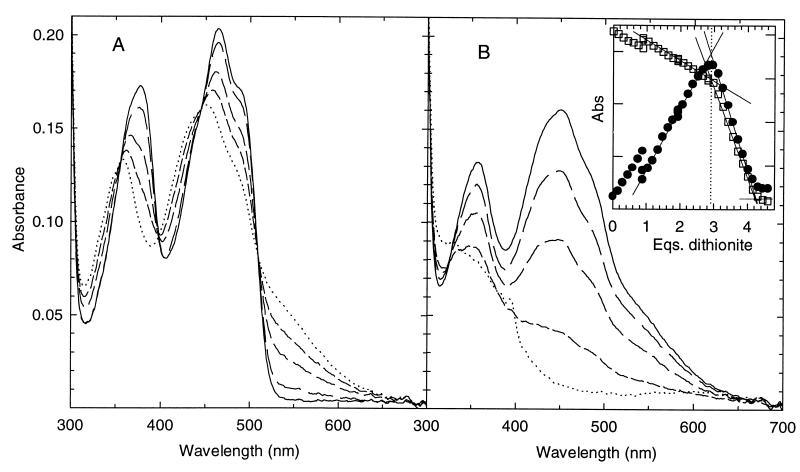
Figure 2.
Titration of oxidized hTrxR with sodium dithionite. (A) Representative spectra showing the emergence of the EH2 species during the first phase of titration. Spectra are in order from solid line to dotted: 18 μM of oxidized enzyme before addition of dithionite, then 0.9, 1.5, 2.1, and 2.7 eq. (B) Representative spectra showing the emergence of the EH4 species during the second phase of titration. Spectra start with the solid line; equivalents of dithionite added are: 2.8, 3.2, 3.5, 4.0, and 4.4. Note the 0.1 equivalent of methyl viologen radical in the last spectrum with the two major absorbance bands, 394 and 600 nm. (Inset) Observed absorbance changes upon titration of hTrxR with sodium dithionite. Conditions are as in Materials and Methods. Note the equivalent points of 0.9, 1.9, and 2.8 where several data points are shown representing longer equilibration times of 50, 50, and 40 minutes, respectively. For all other data points, spectra were recorded after 3–7 min of equilibration time. A540 nm (closed circles) = 0.02 and A463 nm (open squares) = 0.05 for each marking on the left and right y axes, respectively.

