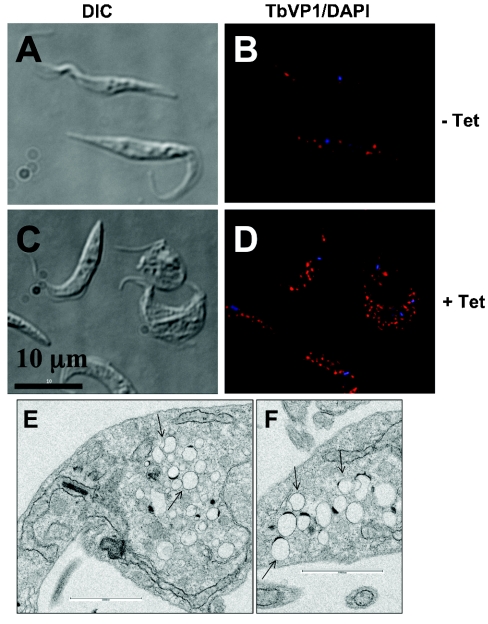
Figure 4. Morphology of acidocalcisomes after ablation of TbVTC1 by RNAi.
Acidocalcisome morphology was assessed before (A and B) and after (C and D) the addition of tetracycline for 4 days by fixing and staining the cells with antibody against TbVP1 (B and D; red). The DAPI staining showed the nuclei and kinetoplasts (blue). Scale bars in (A–D): 10 μm. In addition, the transmission electron microscopic analysis (E and F) after tetracycline induction showed large regions of the cells densely packed with small acidocalcisomes (arrows). Scale bars in (E) and (F): 0.2 μm.

