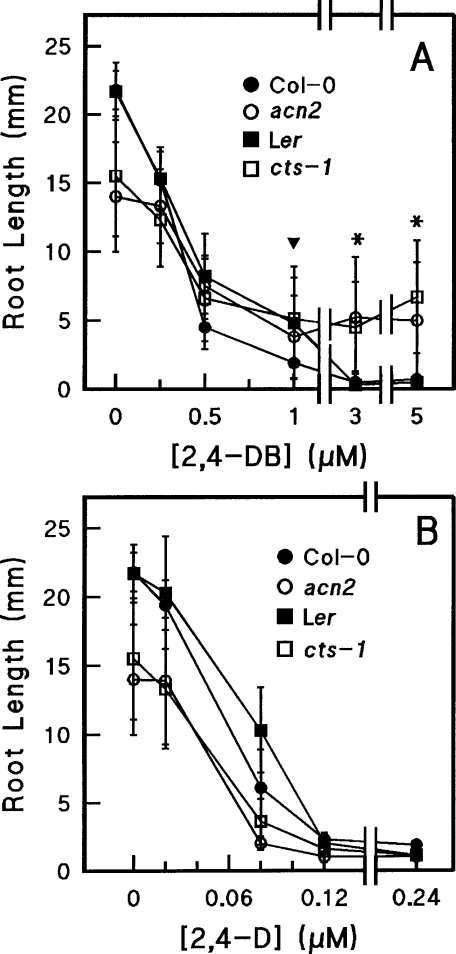
Figure 1. Comparison of 2,4-DB resistance of mutants and wild-type.
Seeds were treated as described in the Experimental section. Root lengths were measured 6 days after transfer to growth conditions. Results are means±S.D. for at least ten seedlings. (A) Root growth in the presence of 2,4-DB. Student's t tests were conducted on data from roots from each mutant and respective wild-type at concentrations of 1, 3 and 5 μM. Symbols: ▼, P<0.01 for acn2 and P<0.1 for cts-1 compared with Ler; *, P<0.0001 for both acn2 and cts-1. (B) Root growth in the presence of 2,4-D. Col-0 and acn2 were significantly different (P<0.0001) at all concentrations. Ler and cts-1 were statistically different at concentrations below 0.12 μM (P<0.0001), but statistically non-significant at concentrations of 0.12 μM and 0.24 μM (P>0.1).

