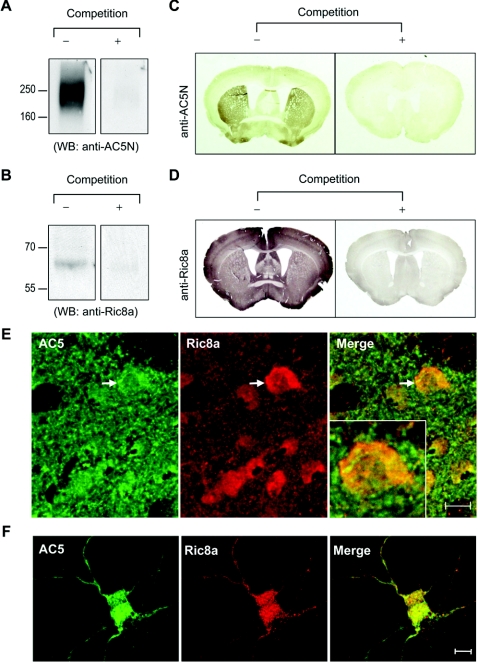
Figure 2. Co-localization of AC5 and Ric8a in vivo.
(A) Characterization of anti-AC5N, an anti-AC5 antibody. Equal amounts (100 μg) of plasma membrane fractions from the striatum were loaded into each lane for Western blot analysis using anti-AC5N (1:10000 dilution) in the absence or presence of excess antigen (GST–AC5N1–215; 500 μg/ml) as indicated. (B) Equal amounts (100 μg) of whole-brain lysates from E19 rat brains were loaded into each lane for Western blot analysis using the affinity-purified anti-Ric8a antibody (1:500 dilution) in the absence or presence of excess antigen (GST–Ric8a; 500 μg/ml) as indicated. Brain sections were stained with either AC5N (C) or the anti-Ric8a antibody (D) in the absence or presence of an excess amount of antigen (500 μg/ml; GST–AC5N1–215 and GST–Ric8a respectively). (E) Double immunostaining of AC5 and Ric8a in the striatum of adult rat brains. AC5 was visualized by the streptavidin Alexa Fluor® 488 (green; left-hand panel). Ric8a was visualized by Alexa Fluor® 568 secondary antibody (red; centre panel). The merged image (yellow) is shown in the right-hand panel. The inset shows high magnification of the striatal cell marked with an arrow. (E) Double immunostaining of AC5 and Ric8a in primary striatal neurons (9 days in vitro). AC5 was visualized by the streptavidin Alexa Fluor® 488 (green; left-hand panel). Ric8a was visualized by Alexa Fluor® 568 secondary antibody (red; centre panel). The merged image (yellow) is shown in the right-hand panel. Scale bars are 10 μm.

