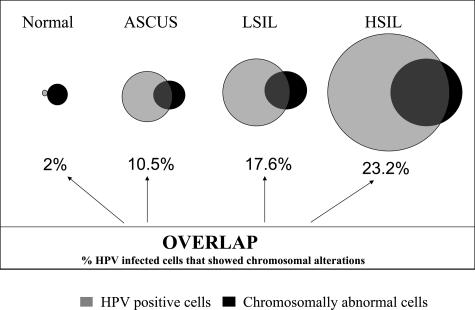
Figure 4.
Relationships between HPV-infected and chromosomally abnormal cervical epithelial cells depicted in a Venn diagram. The numbers beneath the diagram circles reflect the percentage of HPV-infected cells that demonstrated chromosome copy gains for either one or both chromosome markers (3q26 and 8q24 probes).

