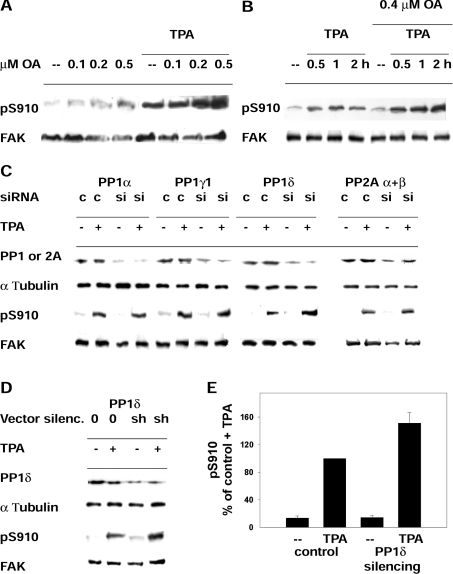
Figure 2. Phosphatase targeting of pSer910 of FAK.
(A) Phosphorylation of Ser910 in cells treated with PMA (TPA) and exposed further to increasing concentrations of okadaic acid (OA). Cells were incubated with or without 300 nM PMA for 40 min and with the indicated okadaic acid concentrations for an additional 40 min. Cells were collected, and lysates were analysed to detect pSer910 (pS910) and FAK. (B) Phosphorylation of Ser910 in cells treated with okadaic acid (OA) and exposed further to PMA (TPA). Cells were incubated with or without 0.4 μM okadaic acid for 20 min, subsequently with 300 nM PMA for up to 2 h and collected at the indicated time points. (C) Effect of transient silencing of PP1α, PP1γ1, PP1δ or PP2A (α+β) and of PMA (TPA) on pSer910. Rat fibroblasts were transfected with siRNA targeting the indicated PP1 or PP2A isoforms (si) or control siRNA (c) at zero time, day 1 and day 2, and collected at day 3, as described further in the Materials and methods section. PMA treatment (300 nM) before collecting cells was for 1 h. siRNA targeting PP2Aα and PP2Aβ were co-transfected. Following Western blotting, the membranes were probed to detect the PP1 or PP2A isoforms, α-tubulin, pSer910 (pS910) and FAK. Blots are representative of three independent experiments. (D) Effect of stable silencing (silenc.) of PP1δ and of PMA (TPA) on pSer910. NIH 3T3 fibroblasts were transfected with either shRNA vector targeting PP1δ (sh) or control empty vector (0), and stable transfectants were prepared by puromycin selection. Cell exposure to PMA and other reagents was as in (C). (E) Quantification of the effect of PMA on pSer910 in cells carrying stable PP1δ silencing. The pSer910 (pS910) bands from cells as in (D) were quantified by densitometric scanning, and the data obtained were normalized by adopting the control+PMA (TPA) value as 100%. Results are means±S.E.M. for four independent experiments, using two different siRNA constructs.

