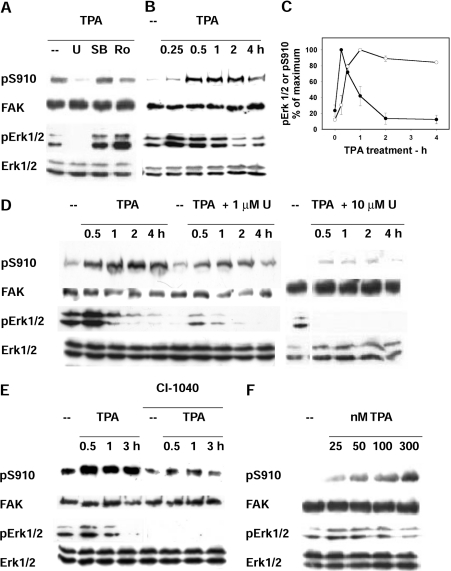
Figure 3. Phosphorylation of FAK Ser910 and ERK1/2 activity in cells treated with PMA (TPA) and with kinase inhibitors.
(A) Treatment with kinase inhibitors. Cells were treated with 300 nM PMA for 1 h in the presence of the following kinase inhibitors: 10 μM U0126, to inhibit MEK1/2 (U); 10 μM SB203580, to inhibit p38 (SB) and 100 μM roscovitine, to inhibit CDKs (Ro). In addition to pSer910 (pS910) and FAK, the activation level of ERK1/2 (pERK1/2) and ERK1/2 protein were detected on cell lysates. (B) Time course of PMA treatment. Cells were treated with PMA for up to 4 h and analysed as in (A). (C) Quantification of the time course of PMA treatment. The pSer910 and pERK1/2 bands from blots as in (B) were quantified by densitometric scanning, and the data were normalized by adopting the maximal value obtained for each phosphoprotein as 100%. Results are means±S.E.M. for four independent experiments. (D) Treatment with U0126. Cells were treated with 300 nM PMA (TPA) in the presence or not of 1 or 10 μM U0126 (U). (E) Treatment with CI-1040. Cells were treated with 300 nM PMA in the presence or not of 1 μM of the MEK1/2 inhibitor CI-1040. (F) Treatment with increasing PMA concentrations. Cells were treated with the indicated PMA (TPA) concentrations for 1 h.

