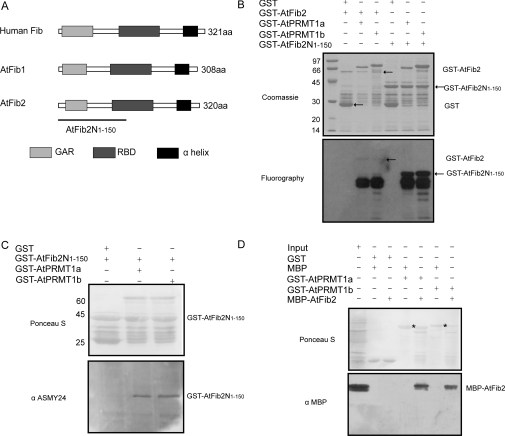
Figure 6. AtPRMT1a and AtPRMT1b methylate and interact with AtFib2.
(A) Schematic diagram of the domain structures of human Fib, AtFib1 and AtFib2. The conserved GAR domains are shown as light grey boxes, the RBDs are shown as dark grey boxes, and the α-helix domains are shown as black boxes. The N-terminal region of AtFib2 corresponding to amino acids 1–150 (AtFib2N1–150) used as the substrate in the methyltransferase assay is indicated by the line. (B) GST–AtFib2 and GST–AtFib2N1–150 were incubated with GST–AtPRMT1a and GST–AtPRMT1b separately in the presence of [3H]SAM. Methylated proteins were separated by SDS/10% PAGE (upper panel) and visualized by fluorography (lower panel). The positions of corresponding proteins are indicated on the right of each panel. Molecular masses are indicated on the left in kDa. (C) AtPRMT1a and AtPRMT1b are Type I PRMTs. Ponceau S staining of the nitrocellulose membrane demonstrated roughly equal loading (upper panel). ASYM24 antibody against asymmetrically dimethylated arginine residues recognized GST–AtFib2N1–150 methylated by AtPRMT1a and AtPRMT1b, not by GST control (lower panel). Molecular masses are indicated in kDa. (D) Ponceau S staining of the nitrocellulose membrane after GST pull-down assays using GST–AtPRMT1a and GST–AtPRMT1b as bait and MBP–AtFib2 as prey (upper panel). The bait–prey protein pairs used in the GST pull-down assay are indicated at the top. GST–AtPRMT1a and GST–AtPRMT1b are indicated by an asterisk. A 10 μl aliquot of E. coli cell extract containing MBP–AtFib2 fusion protein (10% input) was used. The membrane was probed with an anti-MBP monoclonal antibody (lower panel).

