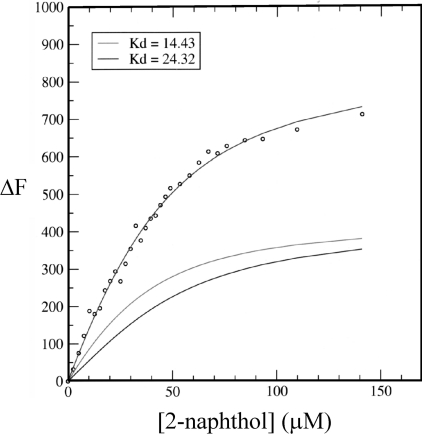
Figure 6. Curves fitted for ΔF at 326 nm with respect to ligand concentration.
The change in fluorescence at 326 nm (ΔF) for ligand binding to trichosurin. ΔF on the y-axis is in arbitrary units. The upper line is the best fit of two exponentials to the data (○) with Kd values of 14.4 (middle line) and 24.3 μM (lower line).

