Figure 3.
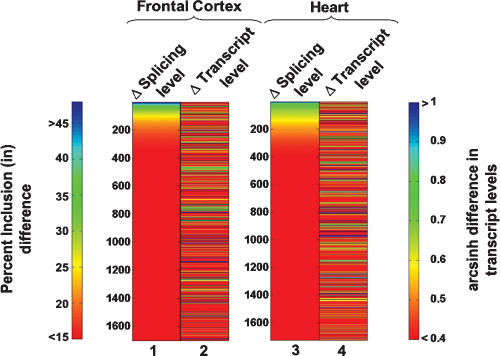
Transcript and AS level differences between humans and chimpanzees involve largely distinct subsets of genes. The color spectrum plots compare splicing level differences and transcript level differences for the same set of genes expressed in the frontal cortex and heart. For each tissue comparison, the left column shows splicing differences (measured as the magnitude of percent inclusion difference, columns 1 and 3) and the right column measures differences in gene transcript level (measured as the magnitude of the hyperbolic arcsine [arcsinh] difference, columns 2 and 4). An hyperbolic arcsine difference of ∼0.4 corresponds to a 1.5-fold change in expression level, and a difference of ∼0.7 corresponds to a twofold difference in expression level.

