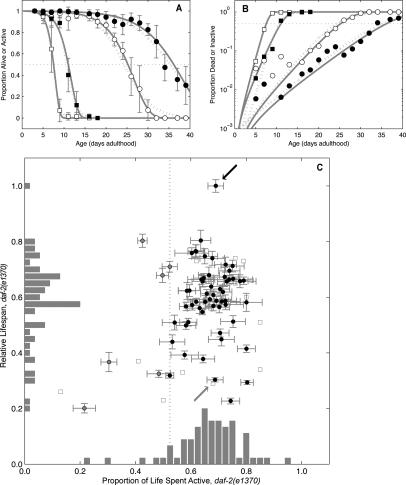
Figure 2.
A shortened relative life span without changing the proportion of an animal’s life spent active distinguishes gene inactivations that accelerate aging. (A) High proportions of inactivity (white symbols) precede high proportions of mortality (black symbols). Shown are daf-2(e1370) animals treated with dsRNA to an empty vector control (circles) or to daf-16 (squares). Error bars are population-weighted standard deviations. Both Gompertz (solid gray line) and logit (dotted gray line) fits are shown. (B) Data and fits replotted with log(proportion) scale indicates that the rate of transition from active to lethargic movement and the mortality rate are positively correlated. (C) Clones with proportion active significantly <1. A vertical line indicates an arbitrary cutoff (lower 10% by clone rank) to identify sick clones (gray circles); e.g., those with proportion active <0.52. All other clones (black circles) are, by this definition, healthy. While clones are widely distributed by relative life span, they are clustered vertically near the empty vector control clone (black arrow) and daf-16 RNAi clone (gray arrow) in terms of proportion of life spent active. Error bars indicate mean ± SD. Clones with unquantified uncertainty in life span or activity ratio, derived as the quotient of mean active span to mean life span, are also shown (squares).

