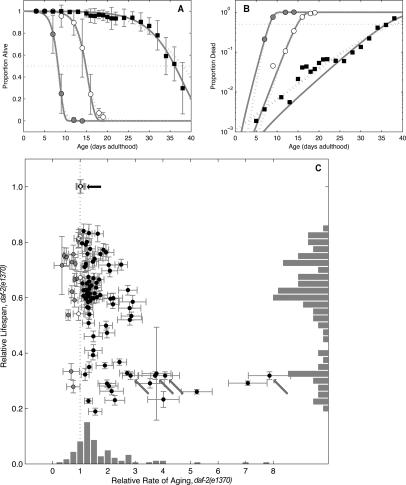
Figure 3.
Decreased insulin signaling extends life span and decreases the rate of aging. In contrast, loss of daf-16 and many of the progeric gene inactivations described here shortens life span and increases the rate of aging. (A) Pooled mortality proportions for wild type (N2); empty vector control RNAi (◦), N2; daf-16 RNAi (●), and daf-2(e1370);vector control RNAi (◼). Error bars are population-weighted standard deviations. Both Gompertz (dark-gray line) and logit (light-gray line) fits are shown. (B) Data and fits replotted with log(proportion) scale. (C) Eighty-one gene inactivations had MRDT ratios significantly >1 (black circles), implying faster aging than empty vector control (black arrow). An additional 14 gene inactivations cause slower rates of aging (gray circles), implying that they were short-lived due to a higher probability of dying throughout life unrelated to aging (increased IMR). For four gene inactivations the rate of aging showed no significant difference (white circles) relative to empty vector control. Error bars indicate mean ± SD. Histograms show relative count of clones within each bin. Three data sets of daf-16 RNAi (gray arrows) were significant; these clones showed significant variation in MRDT ratio. The increasing variation reflects an increasing steepness in slope (i.e., a very high rate of aging) that is difficult to accurately measure, given that life span is being scored every other day in daf-2(e1370).

