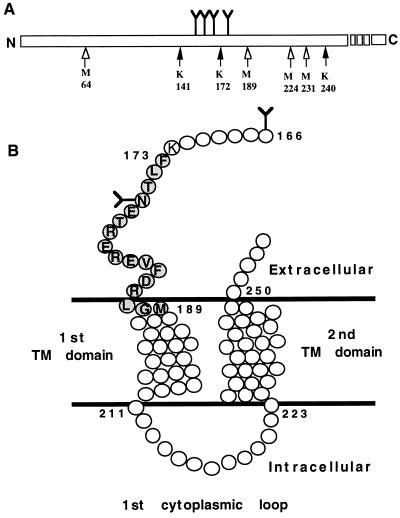
Figure 4.
(A) Schematic representation of all the potential CNBr (open arrows) and Lys-C (solid arrows) cleavage sites within the hPTH/PTHrP receptor sequence that are glycosylated and within the the molecular size range of the largest observed CNBr-generated fragment IB (≈46 kDa). Y represents the position of the four conserved N-linked glycosylation sites. (B) Schematic representation of a membrane-embedded portion of the hPTH/PTHrP receptor (amino-acids 166–254). The agonist-binding receptor domain Phe173–Met189 (shaded circles), identified in this report, is shown. Undetailed structures of the first and second transmembrane (TM) helical domains and the first cytoplasmic loop are included. Y represents putative N-linked glycosylation sites, and open circles represent amino acids.

