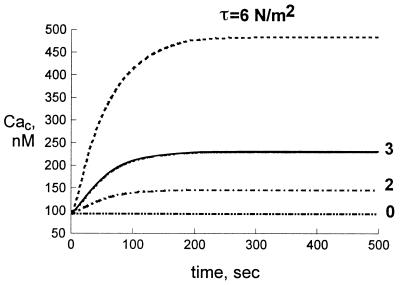
Figure 3.
Response of calcium transient to agonist-free media (cs = 0, Caex = 1.5 mM. The calculation indicates a lack of the peak associated with agonist stimulation. Variation of flow rate indicates that the plateau level increases with increasing shear stress. These results are in qualitative agreement with experiment (25).

