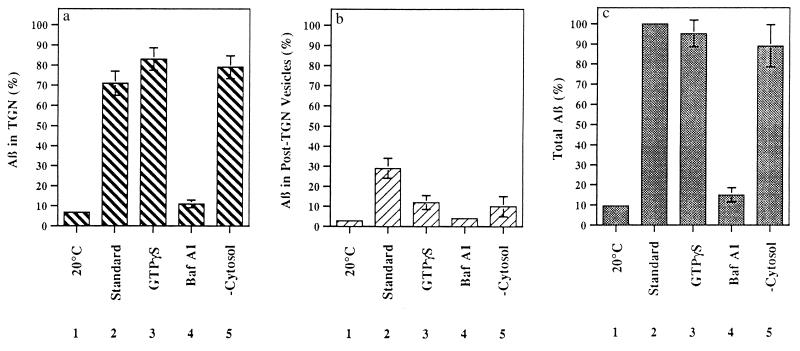
Figure 2.
Quantitative analysis of Aβ formation in permeabilized cells. Cells were incubated for 90 min at 20°C under standard conditions or at 37°C under the conditions indicated. The histograms show the amount of Aβ present in the TGN (a), in post-TGN nascent vesicles (b), and in TGN plus post-TGN nascent vesicles (c). Autoradiographic densities were quantitated using a Bio-Rad PhosphorImager, software version 2.0. In each experiment, data were normalized to total Aβ formed under standard conditions. Data represent means ± SEM for three experiments.

