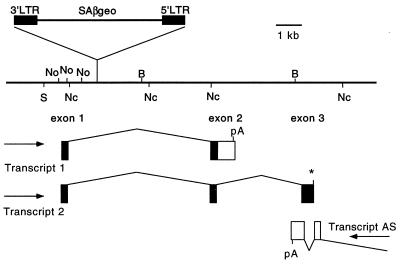
Figure 5.
Map of the ROSA26 genomic region. The line indicates the genomic DNA drawn with the scale and restriction enzyme sites as indicated. The position and orientation of the ROSAβgeo retroviral integration is indicated as are the positions of the exons of the three transcripts that have been mapped. Exons are indicated by rectangles, arrows indicate the direction of transcription of the three transcripts, and lines indicate the splicing patterns for the three transcripts. The 3′ end of exon 2 of transcript 1 and exon 3 of transcript 2 have not yet been determined. B, BglII; Nc, NcoI; No, NotI; S, SalI; pA, poly(A) addition signal.

