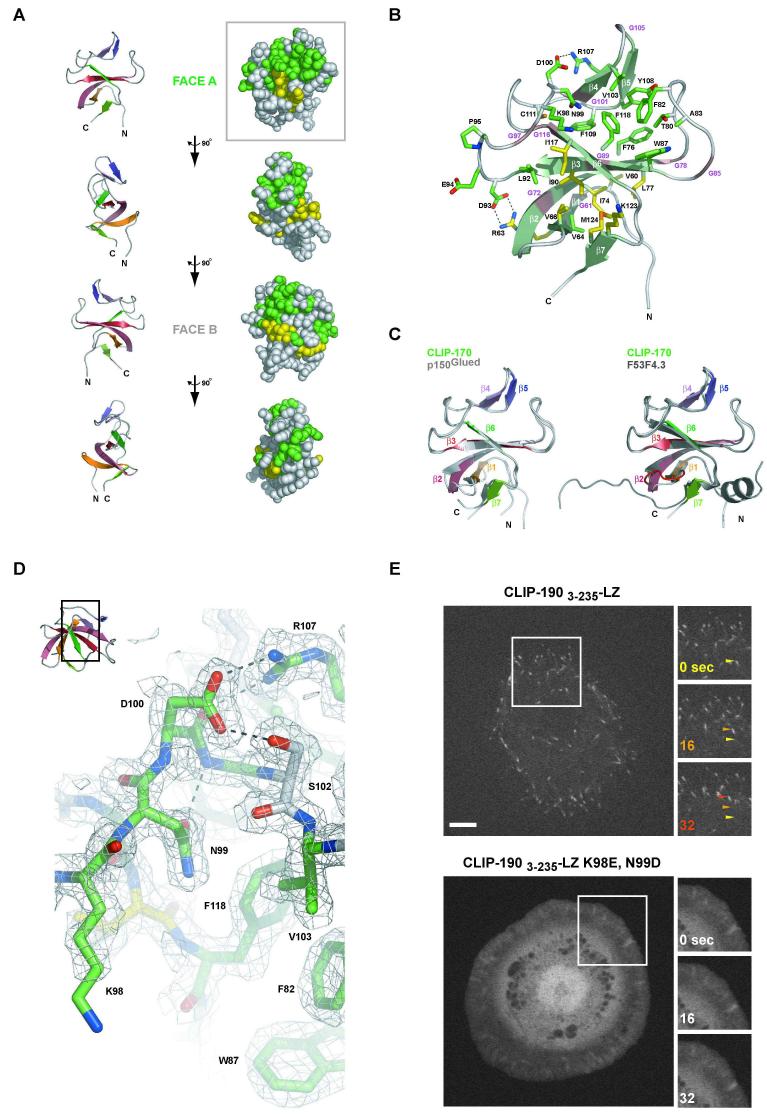
Figure 5. Structure of the first Cap-Gly domain of CLIP-170.
A) 90° rotation of CLIP-170′s first Cap-Gly domain about the y-axis shown above in ribbon format for orientation (left) and in CPK representation for conservation mapping (right) with 80% identity shown in green, 80% conservation in yellow (see Figure S4). B) Ribbon diagram of the first Cap-Gly domain from CLIP-170 with β-strands indicated in light green. Conserved glycine residues that constitute the Cap-Gly domain are indicated along the ribbon in magenta. Conserved residues across Cap-Gly domains (excluding glycines) are indicated in stick format (colored as in A). The D100-R107 and R63-D93 salt bridges are indicated. C) Least squares fit of the CLIP-170 Cap-Gly 1 domain (colored) and the human p150Glued Cap-Gly domain (grey, left)(Honnappa et al., 2006) and the C. elegans F53F4.3 Cap-Gly domain (grey, right) (Li et al., 2002). The loop insert present in F53F4.3 is indicated in red. D) 2Fo-Fc electron density map at 2.0 Å resolution, contoured at 1.0 σ showing a segment of the conserved β3-β4 loop’s GKNDG motif with D100 torsionally fixed via hydrogen bonds to R107 and S102 and the N99 rotamer fixed via a hydrogen bond between its δO and G101’s backbone amine. The GKNDG motif flanks the conserved hydrophobic region F82, W87, V103 and F118 as shown, that together comprise the tentative tubulin C-terminal binding site. Inset (upper left) indicates the relative orientation of the Cap-Gly domain. E) Images of Drosophila S2 cells transfected with CLIP-1903-235-LZ-EGFP (above) and the K98E, N99D mutant (below). Boxed regions at left are shown as time series at right (time in sec. indicated in the upper left). Arrows track a single microtubule tip for the CLIP-1903-235-LZ-EGFP construct across the time series, color-coded according to the time point. Scale bar, 5 μm.

