
Figure 7. In vivo chemical dimerization facilitates microtubule plus end tracking in real time.
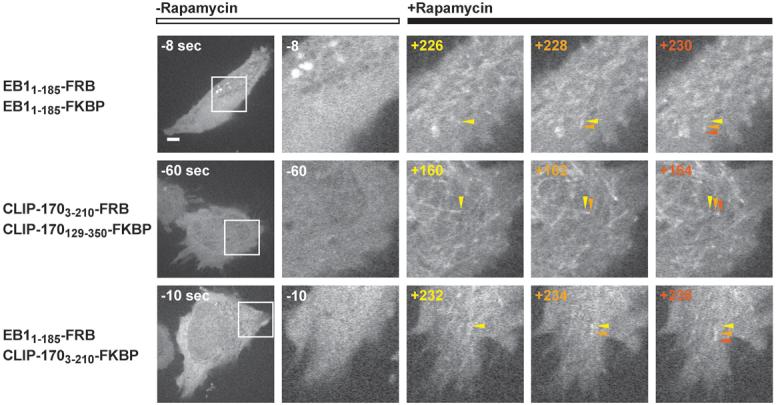
HeLa cells dually transfected with FRB-EGFP and FKBP-EGFP fusions of EB1 and/or CLIP-170. EB1 constructs embody residues 1-185, CLIP-170 constructs residues 3-210 and 129-350. After one minute of imaging, rapamycin was added to the media for a final concentration of 50 nM. Magnified images at right correspond to the boxed region in the first column of the respective row. Images represent a single time point pre-rapamycin treatment and three consecutive time points, taken at 2 sec intervals, post-rapamycin treatment. Arrows, color-coded to the respective time point, track individual microtubule plus ends. Time in sec is indicated relative to rapamycin addition (t = 0 sec). Scale bar in left column, 5 μm.