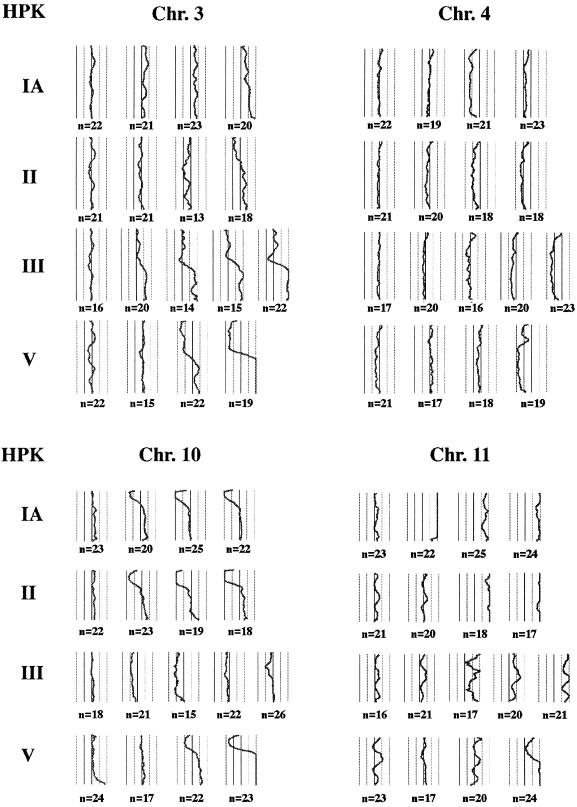
Figure 3.
CGH average ratio profiles of chromosomes 3, 4, 10, and 11 at the different time points analyzed for each of the four HPK cell lines. The ratios of fluorescein isothiocyanate/tetramethylrhodamine B isothiocyanate fluorescence are plotted along the chromosome ideograms. The central line indicates the intensity ratio of a balanced copy number (value of 1), and the thresholds for over- (value of 1.25) and underrepresentation (value of 0.75) are indicated by the adjacent right and left lines, respectively (the far right and left lines represent the values of 1.5 and 0.5, respectively). This figure is comprised of black and white prints of CGH profiles obtained with the cytovision CGH software package.

