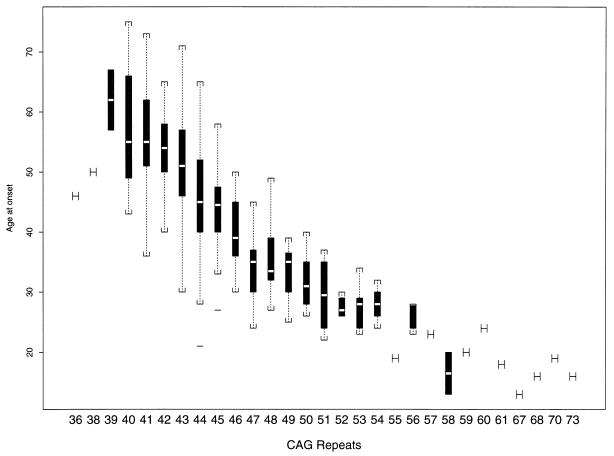
Figure 1.
Relationship between CAG repeat number on HD disease chromosome and age of onset of disease. For each repeat size, the median value is indicated as an open bar, the 95% confidence interval is indicated as the solid box, the range is indicated by brackets, and outlying points by solid lines.

