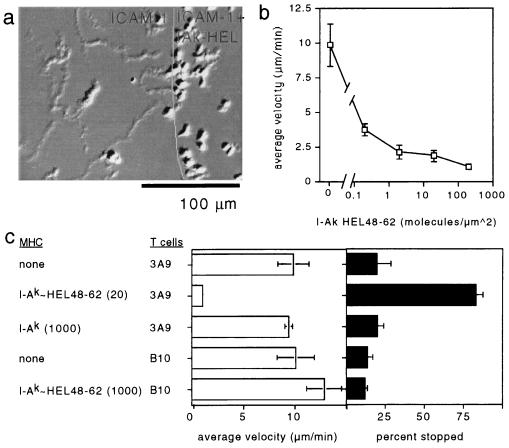
Figure 1.
Effect of antigen receptor engagement on T cells crawling. (a) Visualization of T cell stopping upon antigen recognition. 3A9 T cells on 800 molecules per μm2 ICAM-1 adjacent to 800 molecules per μm2 ICAM-1 + 20 molecules per μm2 I-Ak–HEL48–62 bilayers over 12-min period. The line indicates the boundary between bilayers. (b) T cell migration velocity on bilayers with ICAM-1 and different densities of I-Ak– HEL48–62. (c) Specificity of the stop signal. The average velocity of crawling including stopped cells (Left) and percentage of cells that did not move 10 μm in 12 min—i.e., stopped cells (Right). Conditions are indicated on left axis. The number in parentheses is the density of the MHC molecules in molecules per μm2. All bilayers contain ICAM-1 at 800 molecules per μm2. T cells were maintained in EL-4 supernatant.

