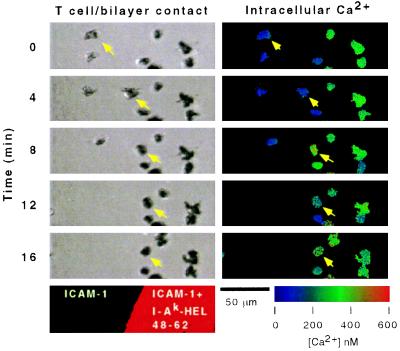
Figure 2.
Visualization of 3A9 cell stopping by antigen and Ca2+ mobilization. (Left) Interference reflection microscopy. (Right) Pseudocolor Fura-2 ratio. (Bottom Left) Fluorescence image indicating ICAM-1 secondary bilayer (unlabeled) and ICAM-1 + I-Ak–HEL48–62 containing primary bilayer (labeled). The arrow indicates a cell that crawled from the 800 molecules per μm2 ICAM-1 bilayer onto the 800 molecules per μm2 ICAM-1 + 20 molecules per μm2 I-Ak–HEL48–62 bilayer, stopped at the boundary, and initiated cytoplasmic Ca2+ oscillations.

