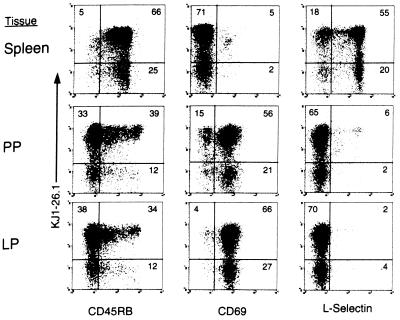
Figure 1.
Surface phenotype of CD4+ T cells in lymphoid and extralymphoid sites. T cells from spleen, PP, and LP of 8-week-old DO11.10 TCR Tg mice were stained with FITC-labeled mAbs specific for CD45RB, CD69, or L-selectin; anti-CD4-PE; and KJl-26.1-BIO followed by Streptavidin-CyChrome. For all populations, lymphoid cells were gated on the basis of forward and 90° angle side scatter and staining for CD4. For each population, the percentage of positively stained cells is shown in quadrants. Quadrants were drawn based on staining with negative control (IgG2a) mAbs. Data shown are representative of more than five experiments.

