Figure 2.
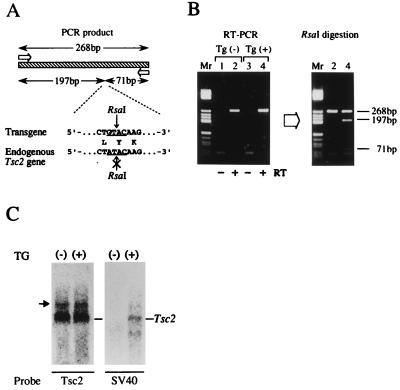
Expression of Tg. (A) Schematic representation of the RT-PCR analysis of Tg expression. The open arrows and striped box indicate primers and the amplified product (268 bp), respectively. Nucleotide and amino acid sequences of the polymorphic site are shown below and the RsaI recognition sequence in the Tg and the corresponding region of the endogenous gene are underlined. RsaI digestion divides the Tg mRNA, but not the endogenous gene, into two fragments (197 bp and 71 bp). (B) Results of RT-PCR analysis. (Left) Results of PCR amplification for kidney RNAs from two F1 offspring of Tg-no.28. Lanes 1 and 2, and 3 and 4 are offspring without the Tg [Tg(−)] and with the Tg [Tg(+)], respectively. Lanes 1 and 3 are negative controls without RT. (Right) Results of RsaI digestion of amplified products. The sizes of the bands are shown on the right. Lane Mr, size marker (pBR322/HaeIII fragments). (C) Northern blot analysis. Equal amount (10 μg) of total kidney RNAs from offsprings of Tg-no.28 with (+) or without (−) Tg are probed with Tsc2 cDNA (Tsc2) or a fragment containing SV40 poly(A) addition signal. The arrow indicates aberrant Tsc2 transcript derived from Eker mutant allele.

