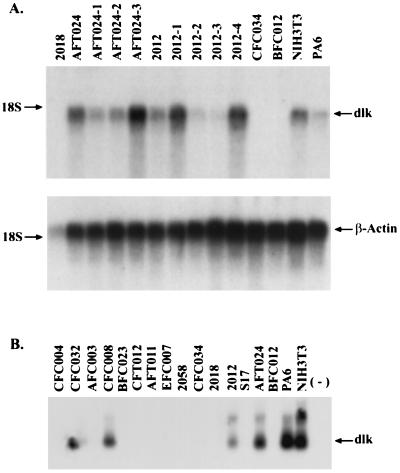
Figure 1.
Dlk expression analysis in stromal cell lines. (A) (Upper) A 1.6-kb dlk transcript is visualized in the parental AFT024 and 2012 cell lines and their subclones, but not in 2018, CFC034 and BFC012. (Lower) The same filter hybridized with a β-actin probe. (B) RT-PCR analysis of 14 fetal liver-derived stromal cell lines and other cell lines.

