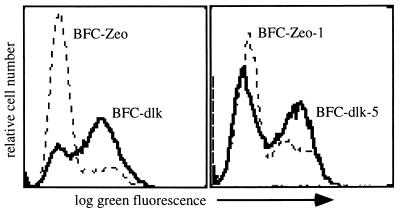
Figure 3.
Membrane-bound dlk expression in transfected BFC012 cells. (Left) A flow diagram of dlk expression in transfected BFC012 populations (BFC-dlk) and cells transfected with the selection plasmid alone (BFC-Zeo). (Right) Expression of dlk in a cloned line (BFC-dlk-5) derived from the expressing population and a control clone (BFC-Zeo-1).

