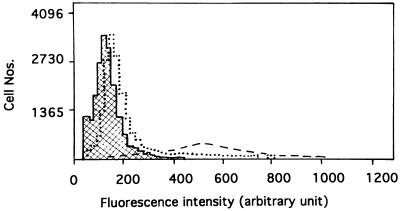
Figure 3.
Effects of agents on cytoplasmic Ca2+ mobilization in ADP-activated platelets. Solid line represents unstimulated fluorescence histogram (baseline control). The change in fluorescence after stimulation with 6.7 μM ADP is shown under the three following conditions: in the absence of agents (dotted line); in the presence of 6.7 μM AppCHClppA or 3.3 μM ApspCHClppsA (solid line, identical to the baseline control); and after the addition of calcium ionophore A23187 (dashed line).

