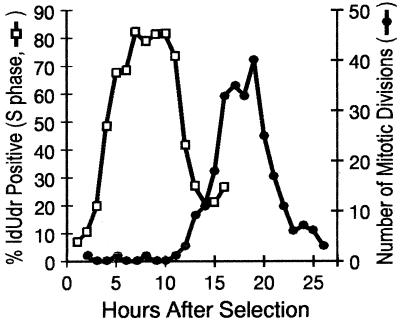
Figure 1.
Synchrony in human Ej cells. Three 75-cm2 flasks of mitotically selected cells were labeled with IdUrd for 1 h at hourly intervals through the cell cycle, and the IdUrd-positive and bead-standardized fluorescence intensity were determined for each of 17 time points. The IdUrd-positive fraction was determined by gating from the bivariate histograms obtained from flow analysis of pulse labeled samples (□). A flask was reserved for digital time-lapse analysis and subsequently scored for the occurrence of mitoses (•).

