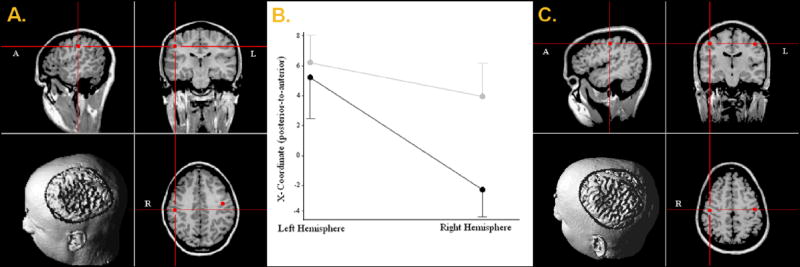
Figure 1.

A-C. The anterior-posterior hemispheric asymmetry observed in control subjects (A), the statistically symmetrical pattern detected in patients (C), and a profile plot of X-coordinate locations for each group (B). In (A) and (C), source localization results for both hemispheres are depicted on the respective participant’s MRI volume, with 2D-images and 3D-renditions displayed in radiological convention (note labels in each thumbnail). In (B), the cerebral hemispheres are along the abscissa with the ordinate showing mean X-coordinate values (in mm) for each group. Gray lines represent the early-onset psychosis group and black lines depict control group data. Error bars indicate one standard error of the mean. As shown, left-hemispheric sources were reliably anterior to those of the right only in adolescent controls.
