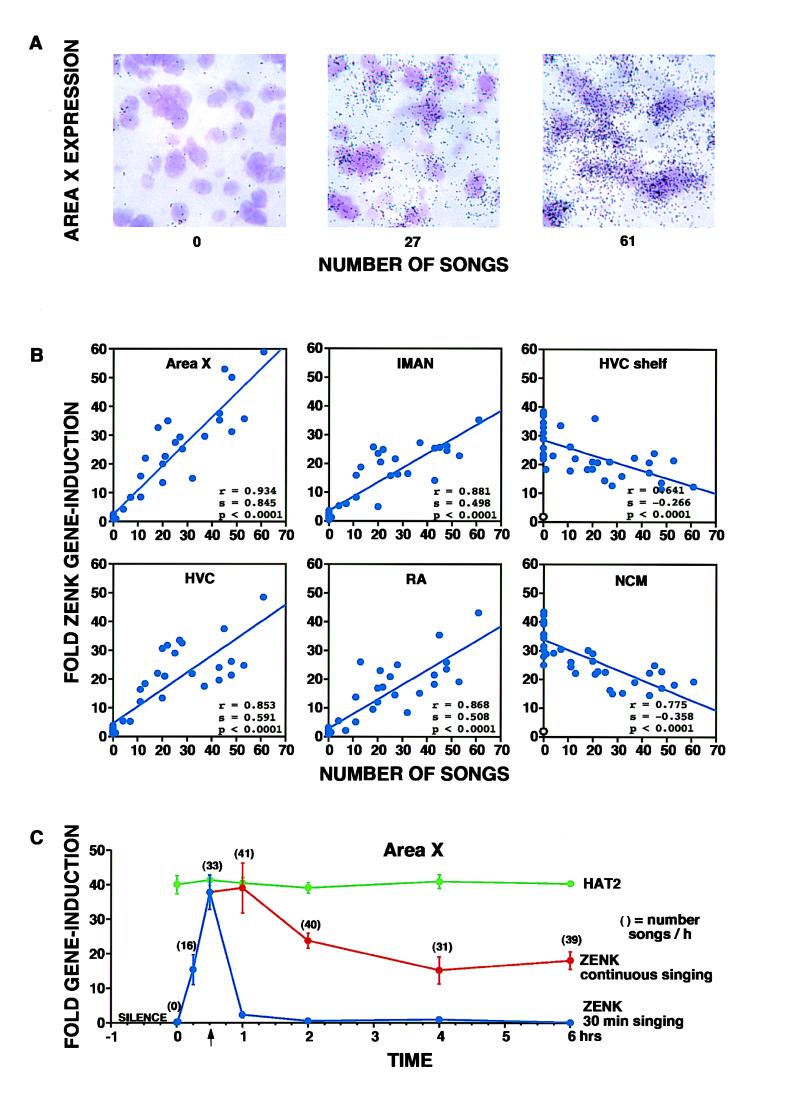
Figure 3.
(A) ZENK expression in area X. Brightfield ×63 magnification shows that the amount of ZENK label (exposed silver grains, black) over cresyl-violet stained cells (purple) was proportional to the number of songs sung during a 30-min period. (B) Quantification of this correlation in four song nuclei (area X, lMAN, HVC, and RA) and in two auditory relays (HVC shelf and NCM), as representative examples. Each solid blue circle represents the value of one canary (n = 37; 22 birds that sang, 15 that did not). For song nuclei, each value was obtained by dividing the total number of grains per cell in a particular nucleus by the average number of grains per cell seen in that nucleus in the birds that did not sing (hearing only group). For auditory relays, the values were divided by the average of those seen in controls that were exposed to silence and did not sing (n = 3) (open circle at the bottom of the shelf and NCM graphs). The solid line through the dots represents the best linear fit of the data. Statistical values were determined by regression analysis. (C) Time course of gene expression in area X before, during, and after singing. ZENK values for strong singers prevented from singing for 1 hr or singing vigorously for 1 min thereafter are overlapped at time 0 with silent controls. Blue curve: ZENK expression in birds that sang for 15 min and then were killed, or for 30 min and then were interrupted (arrow) and killed immediately or at various times thereafter. Red curve: ZENK expression in birds that continued to sing and were killed at various times after the onset of singing. Levels of ZENK expression in this group remained higher than in those that were interrupted (P < 0.05 between 1–6 hr; two-tailed unpaired t test). Green curve: the expression of HAT2, a relatively abundant brain specific gene (24), did not change as a result of singing. Values in brackets represent the average number of songs per group per last hour of sampling except for the first two, which indicate the number of songs during the first 15 and 30 min, respectively (n = 3 birds per time period sampled). Error bars represent SEM.

