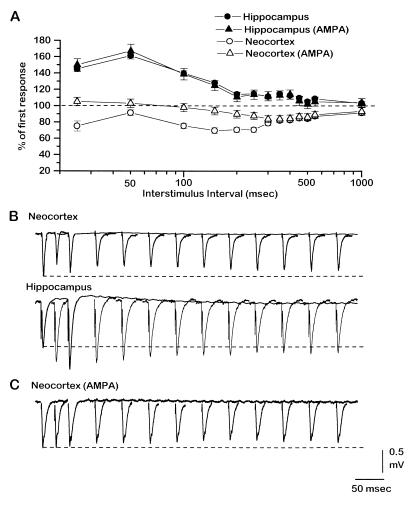
Figure 1.
Short-term synaptic plasticity differs in the neocortex and hippocampus pathways. (A) Percentage change of the response to the second stimulus in a pair with respect to the first as a function of interstimulus interval, in the hippocampus (solid symbols) and neocortex (open symbols) pathways during control conditions (circles) and after blockade of GABAA, GABAB, and NMDA receptors (triangles). Points are means of 10 experiments ± SEM. (B) Representative examples of evoked field potentials from the neocortex (Upper) and hippocampus (Lower) pathways under control conditions. Overlayed are the response to the first stimulus and the responses to the second stimulus at different interstimulus intervals (25, 50, 100, 150, 200, 250, 300, 350, 400, 450, 500, and 550 msec). Dashed lines show amplitude of first response for reference. (C) Representative examples of evoked field potentials from the neocortex during blockade of GABAA, GABAB, and NMDA receptors, stimulated as in B. After drugs were applied to block these receptors the stimulation was lowered to match the amplitude of the first response in the pre-drug condition. This change in stimulation strength did not affect the paired-pulse ratio.

