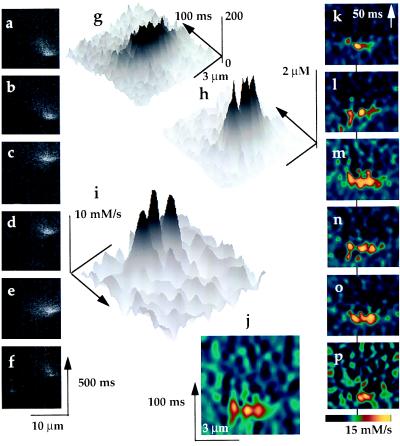
Figure 3.
Multifocal release sparks. (a–e) Repeated fluorescence sparks, originated at the same spot in the scan, 13 μm from the edge of the cell. Shown are the first 5 of 36 wide sparks generated in a 10-min interval. (f) A narrower spark that originated at the same spot (no. 11 in the sequence). (g) Average fluorescence in the five sparks in a–e. The average resting fluorescence was 29, the peak 165, and dyeT(x) ≃ 31 μM. (h) [Ca2+]i(x, t), derived from the averaged fluorescence. (i and j) Two representations of the Ca2+ release flux, calculated with the parameters given in Fig. 2. (k–o) Release flux images derived from the individual fluorescence sparks, showing in all five, indications of three release foci. (p) Release from the fluorescence in f.

