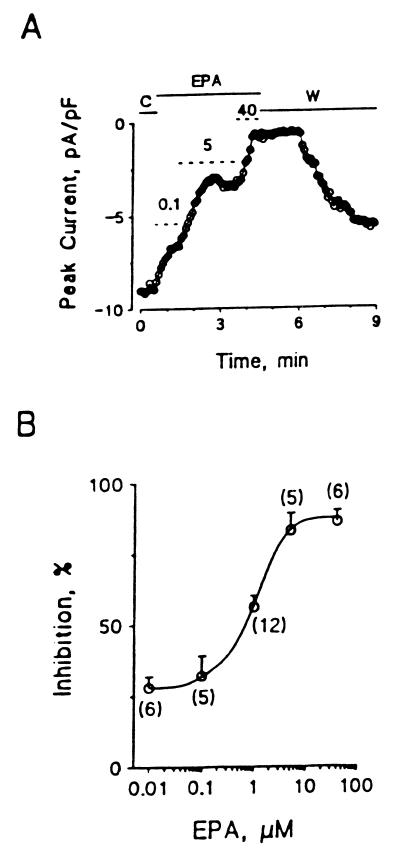
Figure 2.
Inhibition of ICa,L by EPA in cultured neonatal rat ventricular myocytes. (A) Time course of the inhibitory effect of EPA on the peak ICa,L. The dotted short lines marked with 0.1, 5, and 40 represent the periods of extracellular puffing 0.1, 5, and 40 μM EPA. C, control; EPA, application of EPA; W, washout of EPA with the bath solution alone. (B) The concentration-dependent curve of EPA suppression of ICa,L. The number in parentheses represents individual ventricular myocytes treated with various concentrations of EPA. The IC50 of EPA is 0.8 μM.

