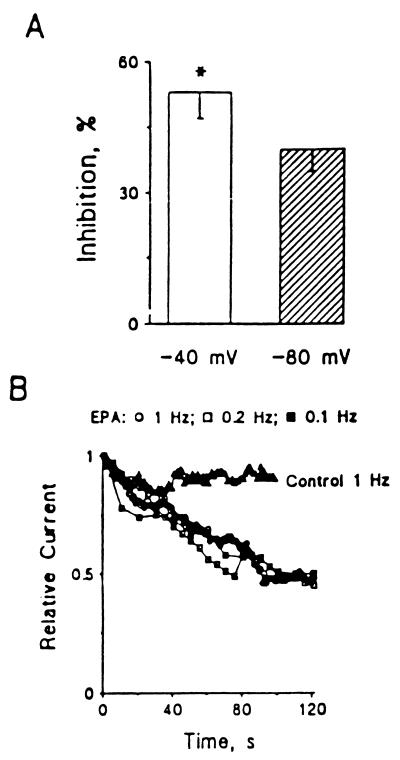
Figure 3.
Voltage- and time-dependent suppression of Ca2+ currents by EPA in cultured neonatal rat ventricular myocytes. (A) x axis represents the holding potentials. y axis represents the relative peak Ca2+ currents evoked by depolarizing pulses from −40 or −80 mV to 0 mV. (B) Time-dependent inhibition of Ca2+ currents in cultured neonatal rat ventricular myocytes. Ca2+ currents were elicited by a train of depolarizing pulses from a holding potential of −40 mV to 0 mV after a 1- to 2-min rest. Relative current was calculated by ICa,L(EPA)/ICa,L(control) recorded from the same myocyte. ▵, control, 1 Hz, n = 4; ○, 1 μM EPA, 1 Hz, n = 4; □, 1 μM EPA, 0.2 Hz, n = 3; ▪, 1 μM EPA, 0.1 Hz, n = 5.

