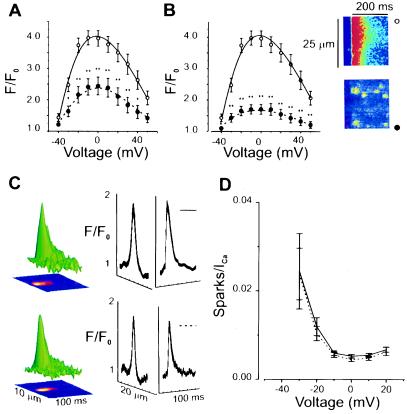
Figure 5.
Effects of EPA on [Ca2+]i transients and Ca2+-sparks in adult rat ventricular myocytes. Voltage protocol as in Fig. 1. (A) [Ca2+]i transient measured as peak fluorescence (F) at the test potential compared with fluorescence at −80 mV (Fo), F/Fo. Control (open circles, solid line); 1.5 μM EPA (filled circles, dashed line). (B) Same as A but 15 μM EPA. (Right) Line-scan image of a [Ca2+]i transient under control conditions at 0 mV (Upper) and after EPA (Lower). Individual Ca2+-sparks can be visualized readily after the application of EPA. (C) Signal-averaged Ca2+-spark under control conditions (Upper) τ =19.6 ± 1.4 ms (n = 46) and after the application of 15 μM EPA (Lower) τ =18.3 ± 1.7 ms (n = 33). (D) Ca2+-spark number normalized by the magnitude of ICa (EC coupling “gain function”) under control conditions, solid line (n = 9) and after 15 μM EPA, dashed line (n = 10). Significance for A and B: ∗∗, P < 0.01; ∗, P < 0.05.

