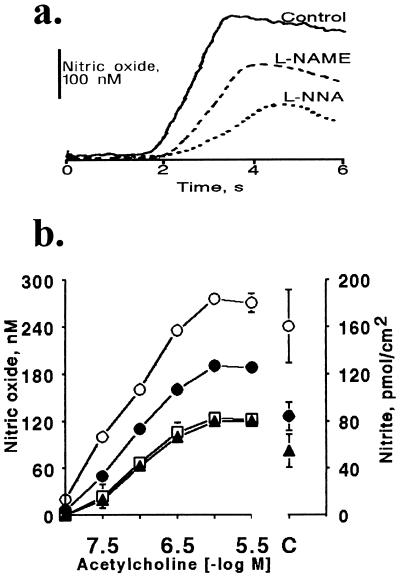
Figure 1.
Effect of l-NAME and l-NNA on ACh-induced release of NO and nitrite from rabbit carotid artery. (a) Tracings of typical amperograms obtained with porphyrinic microsensors showing release of NO (nM) caused by ACh (3 × 10⁻⁶ M) added at time zero under control conditions, or after treatment with l-NAME (3 × 10⁻⁵ M) or l-NNA (3 × 10⁻⁴ M, respectively). (b) Plot of peak concentration of NO released in response to each individual ACh concentration (−log M) shown on the left ordinate (n = 12), or cumulative amount of nitrite (pmol/cm2) following the entire concentration response to ACh (10−8–3 × 10⁻⁶ M) shown on the right ordinate (C, n = 11). NO release was determined in response to ACh under control conditions (○), or after treatment with l-NAME (3 × 10⁻⁵ M; •), l-NNA (3 × 10⁻⁴ M; □), or the combination of l-NAME and l-NNA (3 × 10⁻⁵ M and 3 × 10⁻⁴ M, respectively; ▴). Data are means ± SEM; error bars for NO release in most cases are not visible on the graph due to the size of the symbols.

