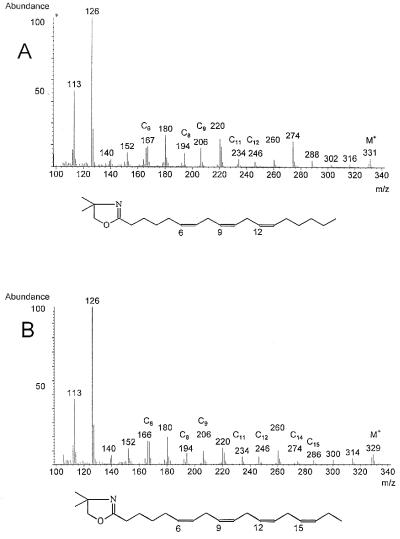
Figure 4.
Mass spectra of DMOX-derivatized fatty acids. Spectra of the fatty acids identified in Fig. 3 as GLA (A) and OTA (B). Details of the interpretation of the spectra are given in the text. The deduced structures of the fatty acid derivatives are shown.

