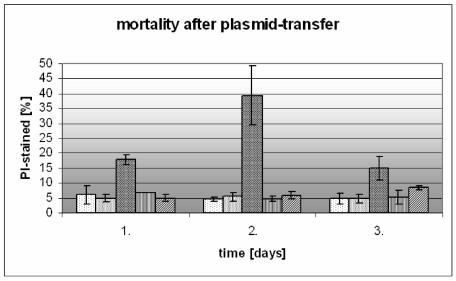
Figure 5.
Measurement of the cellular mortality after plasmid transfer with transport or transfection. The different mortality dependent on the transfer method is demonstrated over a three days time period; the mortality of the transported, transfected and control was compared. A propidium iodide staining was used as indication for dead cells after transfer of the plasmid. The ordinate reveals dead cells [%], the abscissa shows the days after transfer. Control  Sham Control
 LipofectAmin
  ORI 1
ORI 1 ORI 2
ORI 2

