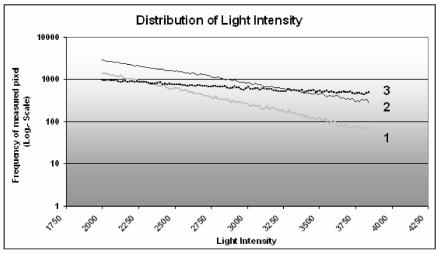
Figure 7.
Distribution of light intensities. The graph exhibits both the light intensities of untreated control cells (1) as well as the light intensities of Clamp-PNA-BioShuttle phNIS-IRES-EGFP (2) and LipofectAmin (3) treated HeLa cells in comparison. The ordinate represents the frequency (log. scale). The abscissa shows the relevant light intensities between 2000 and 4080.

