
Figure 4. SDF1 mRNA expression in the DRG following ddC injection.
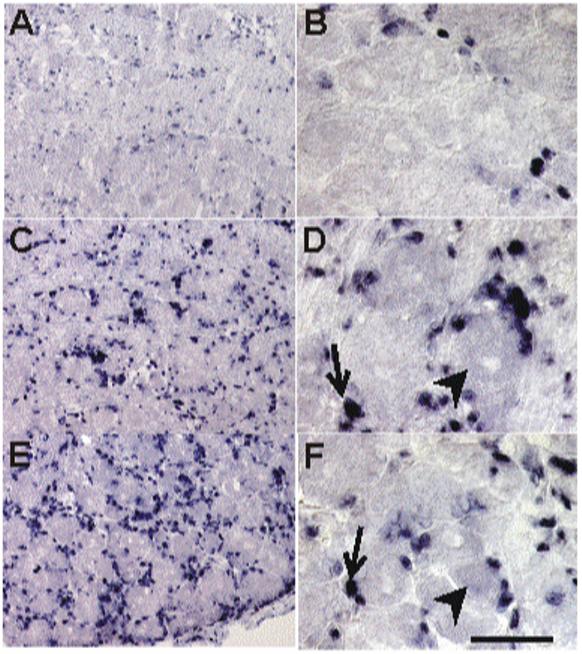
In situ hybridization was used to assess the expression pattern of SDF1 mRNA. A) Low power and (B) high power photomicrograph of basal expression of SDF1 mRNA was observed in the lumbar DRG from saline injected rats, mainly in non-neuronal cells (small, densely stained cells). After a single injection of ddC, the level of SDF1 mRNA expression increased at post-injection day (PID) -7 (C, low power magnification; D, high power magnification) and PID14 days (E, low power magnification; F, high power magnification). Most of the expression appeared to be in non-neuronal cells, however some neurons were also positively labeled. (Arrows, glia positive for SDF1 mRNA; arrowheads, neurons positive for SDF1 mRNA). Scale bar A, C and E is 100 μm; B, D and F is 50 μm (n = 4 for each time point).